The Economics of C&I Energy Storage: How the Savings Actually Add Up
- Share
- publisher
- Vodloon Team
- Issue Time
- Oct 10,2026
Summary
Where exactly do C&I energy storage savings come from? Walk through the economics with worked examples: demand-charge shaving worth $18,000 a year, daily time-of-use arbitrage, avoided downtime, and value stacking to a 4–6 year payback.
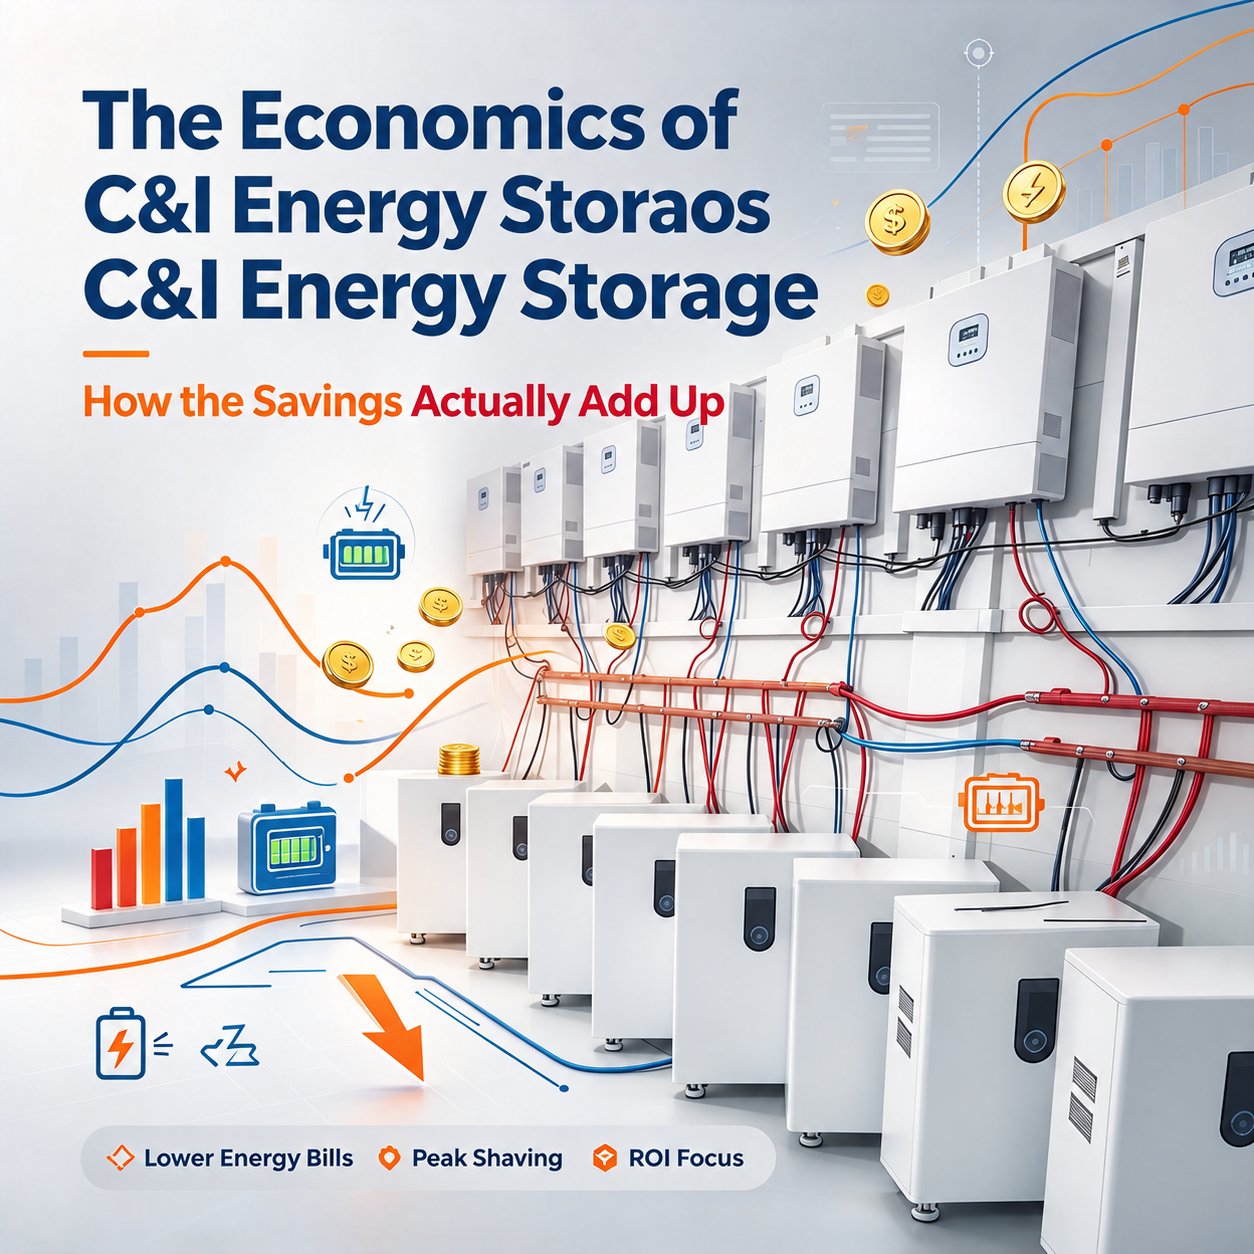
Most businesses already know that commercial and industrial (C&I) energy storage cuts costs. The harder question is how — where exactly the savings come from, and how big each stream can get. This guide walks through the economics with worked examples, so you can see the money before you sign anything.
(For what a C&I system is and which factors to weigh before investing, see our guides on the 5 key factors before investing in C&I storage and industrial energy storage for factories.)
Stream 1: Shaving demand charges
Many utilities bill businesses not just for energy (kWh) but for power (kW) — based on the single highest 15-minute demand window of the month. That one expensive spike can set the charge for everything.
Worked example: A factory regularly peaks at 500 kW. Its tariff includes a $15/kW-month demand charge. A battery that discharges during the peak window and flattens it to 400 kW saves:
- 100 kW shaved × $15/kW = $1,500 per month — roughly $18,000 per year, from one flattened peak.
Because the demand charge resets every month, this saving repeats for the life of the system — and it usually requires only a fraction of the battery's capacity.
Stream 2: Time-of-use arbitrage
Where tariffs vary by hour, a battery charges when electricity is cheap and discharges when it is expensive. The spread becomes recurring margin.
Worked example: A warehouse on time-of-use pricing pays $0.06/kWh overnight and $0.18/kWh at peak. A 200 kWh battery cycled once a day, at ~90% round-trip efficiency, captures:
- 200 kWh × 90% × ($0.18 − $0.06) ≈ $21 per day — over $7,500 per year, before counting the solar-charged portion, which is free.
Pair the battery with on-site solar and the economics improve again: daytime charging from the array instead of the grid pushes the effective spread toward the full peak rate.
Stream 3: Avoided downtime
For manufacturers, cold-chain operators, and data rooms, storage is insurance that pays for itself. A seamless switchover to battery power during an outage or voltage sag prevents spoiled batches, idle lines, and lost data — losses that can exceed the cost of an entire storage system in a single event. Backup value is harder to put in a spreadsheet than demand savings, but for outage-exposed facilities it is often the decisive stream.
Stacking the streams
The real economics of C&I storage come from value stacking — one battery earning several streams at once:
- Solar self-consumption (store midday surplus, use it at night)
- Demand-charge shaving (protect the monthly peak)
- Time-of-use arbitrage (buy low, discharge high)
- Backup and power-quality protection (avoid downtime and penalties)
Well-sized projects in high-tariff markets routinely reach payback in 4–6 years — with the asset continuing to earn for a 25-year design life.
From savings to a decision
Turning these streams into a system requires the right sizing, chemistry, and certifications — the topics of our companion guides on the 5 key investment factors and sizing an industrial storage system. Vodloon brings 200+ delivered C&I projects, an integrated PACK-BMS-PCS-EMS stack, and ISO-certified, Six Sigma production with CE, IEC, and UL compliance.